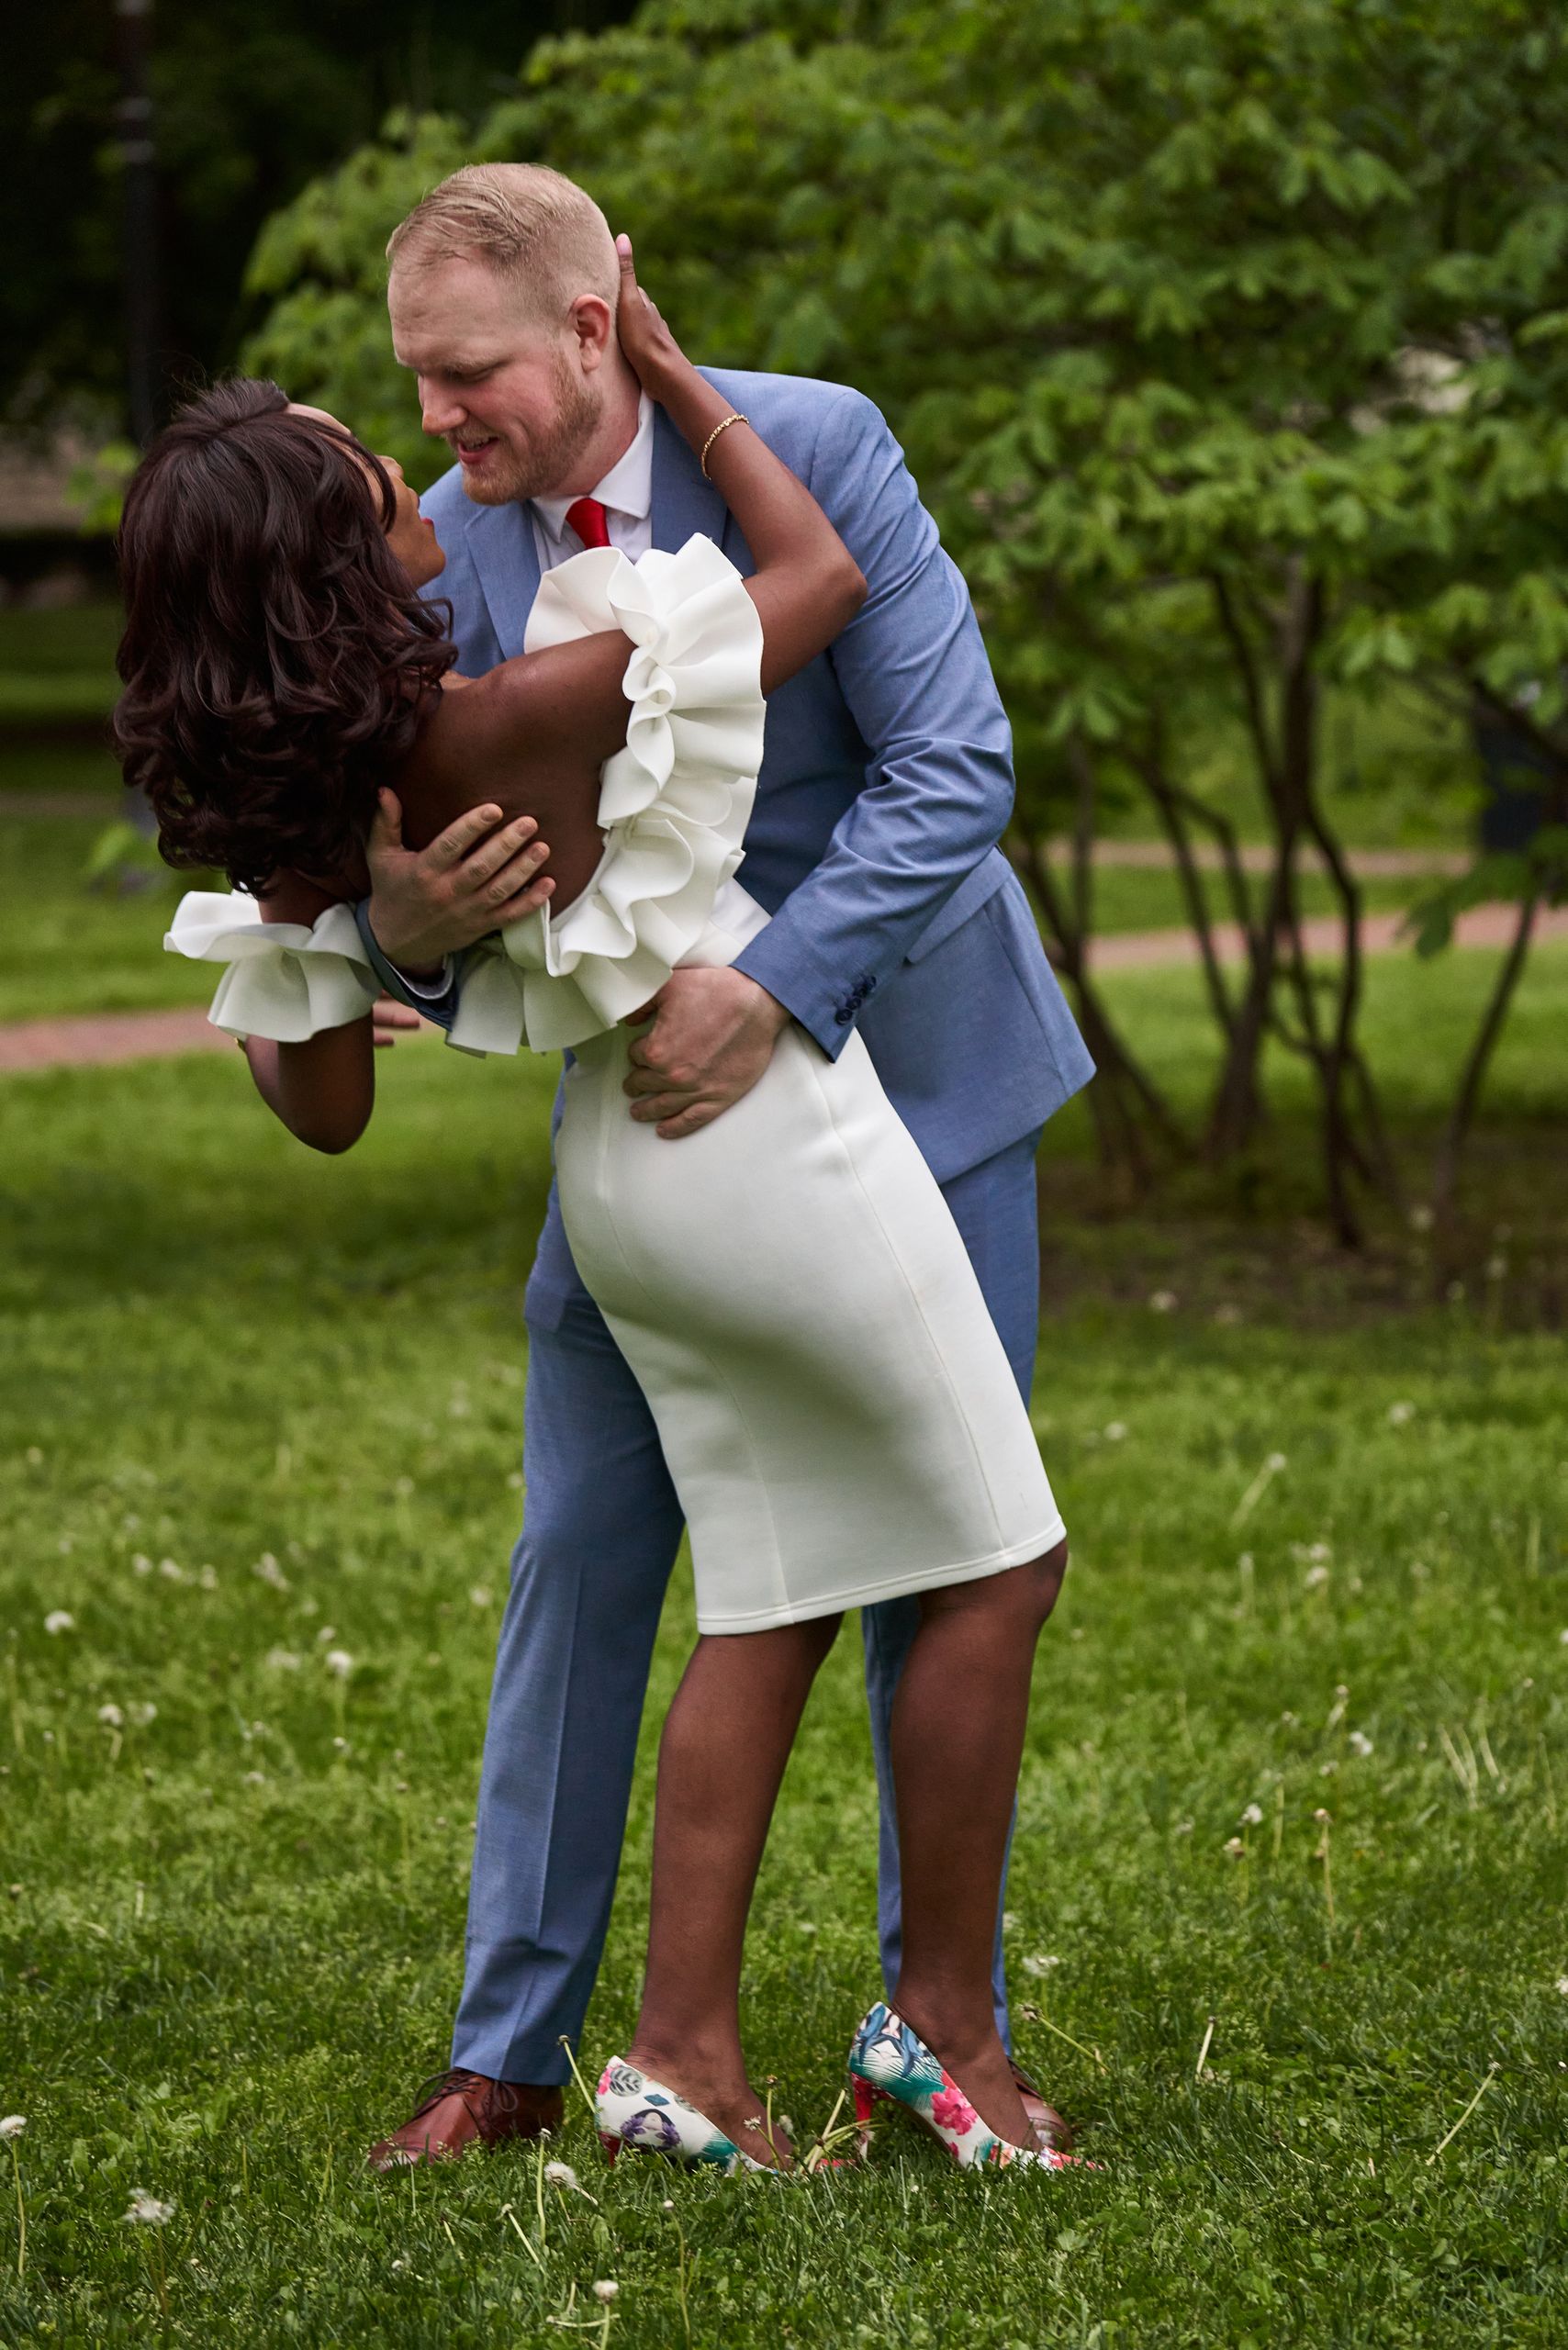
In 1980, 7% of newlyweds in the United States married someone of a different race or ethnicity. By 2015, that figure had climbed to 17%, according to Pew Research Center’s landmark report marking 50 years since Loving v. Virginia, the Supreme Court decision that struck down bans on interracial marriage nationwide. Pew describes the trend as having climbed steadily every year since 1967, when just 3% of newlyweds were intermarried. The share of Americans in an interracial marriage overall grew from 3 million people in 1980 to roughly 11 million by 2015, about 10% of everyone married in the country. What still gets treated in conversation like a recent shift is, by the numbers, one of the most consistent, decades-long trends in American family life.

The growth isn’t happening at the same pace everywhere
Pew’s data, drawn from its full analysis in “Trends and Patterns in Intermarriage”, breaks the national number down by group, and the differences are sharp. Among Black newlyweds, the intermarriage rate more than tripled since 1980, from 5% to 18% by 2015. White newlyweds saw their rate nearly triple as well, moving from 4% to 11%. Asian and Hispanic newlyweds already had far higher intermarriage rates by 2015, at 29% and 27% respectively, though those numbers drop to 46% and 39% when narrowed to U.S.-born Asian and Hispanic newlyweds specifically, reflecting how immigration patterns shape the national averages differently than the experience of American-born adults in those communities.
What’s actually driving four decades of steady growth
None of this happened by accident or public campaign. Pew’s researchers point to several forces working together: rising racial and ethnic diversity in the U.S. population overall, increased educational attainment and geographic mobility that put more people from different backgrounds into the same schools and workplaces, and a decades-long softening of the social and legal barriers that once made interracial relationships difficult or, before 1967, illegal in large parts of the country. Younger generations are consistently more likely to intermarry than older ones, which is part of why the national rate keeps climbing rather than plateauing.
It also reflects a broader shift in attitudes that Pew has tracked alongside the marriage data itself. Acceptance of interracial marriage has grown across every age group and political affiliation over the same period the intermarriage rate has climbed, suggesting the behavioral trend and the attitude shift are feeding each other rather than one simply lagging behind the other.
Attitudes moved just as fast as the marriage numbers did
The behavior shift lines up almost exactly with a matching shift in how Americans talk about it. In a companion analysis, Pew found that 39% of adults now say the growing number of interracial marriages is good for society, up from 24% as recently as 2010. Opposition has collapsed even faster on the personal level: only 10% of Americans say they’d have a problem with a close relative marrying someone of a different race, down from 31% in 2000. Among non-Black Americans specifically, objection to a Black-white marriage in the family fell from 63% in 1990 to 14% in the years just before Pew’s report, a reversal that would have been hard to imagine for most of the 20th century.
Geography still shapes how visible any of this is day to day. Honolulu has the highest share of interracial newlyweds among major metro areas at 42%, followed by Las Vegas at 31% and Santa Barbara at 30%, while intermarriage in general runs higher in cities (18%) than in rural areas (11%). Hawaii leads every state with 44% of infants born multiracial, compared to just 4% in Vermont. Nationally, one in seven U.S. infants, 14%, is now multiracial or multiethnic, nearly triple the 5% share recorded in 1980. That statistic alone suggests the marriage trend isn’t slowing down anytime soon; it’s already reshaping the next generation before those kids are even old enough to fill out a survey themselves.
A trend line worth sitting with
The size of the shift is easy to undersell when it’s described only in percentage points. Going from 3% of newlyweds in 1967 to 17% in 2015 means the practice went from statistically rare to something most American families have some direct connection to, whether through a sibling, a cousin, a child, or a person’s own marriage. It’s not a story about a single generation deciding to do things differently. It’s four generations, each one a little more likely than the last, adding up to a genuinely different American family landscape than the one their grandparents grew up in. The number hasn’t leveled off yet, and there’s no data suggesting 2015 was anywhere near its ceiling.